
Oilfield Freeze Off Downtime Cost: What It Adds Up to in Q4 LOE
Field Reality
The real oilfield freeze off downtime cost isn’t the frozen line itself. It’s the three days it can take the office to find out about it, if nothing changes before winter sets in. A line freezes overnight, a well goes down, and nobody knows until the pumper calls in, or worse, until the monthly production report comes in short.
For a lot of small and midsize operators, downtime tracking still lives in a pumper’s head and a stack of handwritten gauge sheets. Ask around your own field team what happened last winter, and you’ll likely hear some version of “the well was down a few days at some point,” with nobody able to say exactly which well, for how long, or what it cost. That’s the gap worth closing now, while there’s still time to plan for it, not once the first hard freeze has already caught your team flat-footed.
This is the pattern every October through February: temperatures drop, flowlines and separators freeze, downtime spikes. The operators who go into the season with a real-time way to see it stay ahead of it. The ones who don’t spend the winter playing catch-up.
Calculating Your Real Oilfield Freeze Off Downtime Cost
Downtime is expensive in ways that are easy to underestimate, and the oilfield freeze off downtime cost compounds fast once you run the numbers ahead of time, before the season decides them for you.
Take a well producing 20 BOPD. If it freezes off and stays down for a week, that’s roughly 20 barrels of deferred production per day. At $100/bbl, that’s $2,000 a day, or roughly $14,000 for a week-long outage that goes unnoticed over a weekend. Multiply that across a field of 15 to 20 wells during a single hard freeze event, and one bad cold snap could cost a small operator six to seven figures in deferred revenue, if there’s no plan in place to catch it early.
(WTI prices shown as of publish date. Run this math against current pricing before you present it, since a swing of even $10-20/bbl moves these figures meaningfully.)
The LOE side is just as avoidable. A reactive freeze-off response, sending a pumper back out after the fact, thawing lines, restarting equipment, costs more in labor and time than the same fix caught in hour one. Winterization work scheduled ahead of the freeze is planned labor. The same work done after a line has already frozen becomes emergency labor at time-and-a-half.
There’s a compliance angle worth planning around too. State production reports and investor reports both expect accurate uptime figures. When downtime isn’t documented in real time, operators end up reconstructing it after the fact from memory, which is exactly when discrepancies show up in a Texas RRC PR filing or a Down Time Report an investor asks to see.
SaaS Solution Workflow
The fix isn’t more phone calls to the field once winter hits. It’s putting a system in place now that replaces “I think the well was down” with a timestamped record that starts the second something goes wrong, so the oilfield freeze off downtime cost never gets the chance to snowball.
Here’s how that workflow runs with iWell:
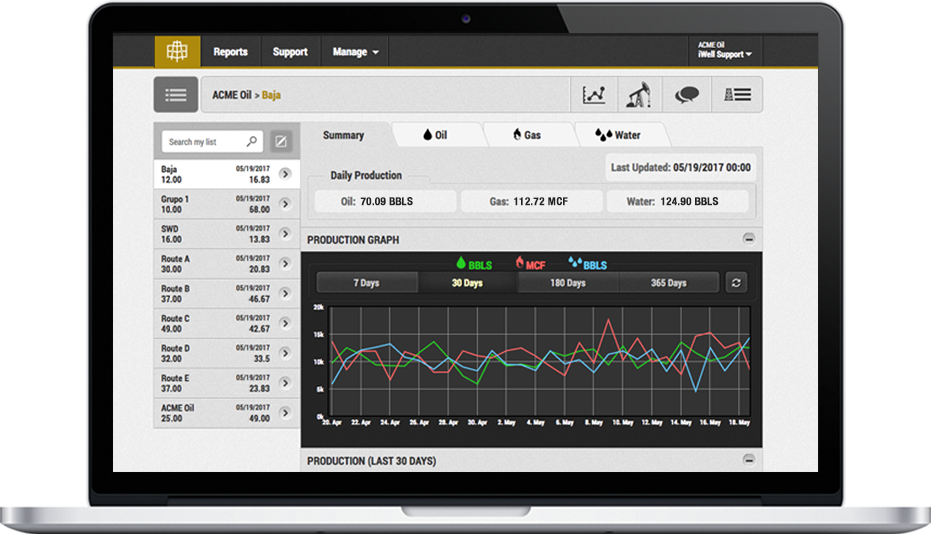
- iWell Remote catches it first. Tank monitors and pressure sensors report readings automatically, even with zero internet or cellular coverage at the well. A dead flowline or a stalled stroke counter shows up in the data within 15 minutes, not three days later.
- Instant alerts go out immediately. The office gets a text or email the moment a well’s readings flatline, before the pumper’s next scheduled route. That’s the difference between a two-hour fix and a two-day outage.
- The Down Time Report builds itself. Every minute a well is up or down gets logged automatically, with hours on, hours down, and percentage uptime calculated for you. No pumper has to remember to write it down, and no office admin has to reconstruct it at month-end.
- Comments travel with the data. If a pumper notes “line froze at the wellhead, thawed and restarted,” that comment attaches directly to the down time record, so when an investor or a state auditor asks what happened, the answer is already there.
The result is a Down Time Report that reflects what actually happened in the field, generated the moment the data comes in, not reconstructed from memory two weeks later. Read more about how this pairs with remote monitoring in last week’s post.
Actionable Takeaways
Before the first hard freeze hits your field this winter, walk through this checklist now, while there’s still time to act on it, to get ahead of your oilfield freeze off downtime cost:
- Pull your current Down Time Report and check for gaps. If wells show clean 100% uptime through last winter’s cold snaps, that’s a red flag, not a good sign.
- Identify your highest-risk wells. Older flowlines, exposed separators, and wells without heat tape are the ones that go down first. Prioritize these for remote monitoring.
- Set alert thresholds now. Decide what a “flatlined reading” looks like for your operation and make sure someone is actually watching for the alert, not just receiving it.
- Cross-check against your LOE budget. If you can’t tie last winter’s downtime hours to a dollar figure, you’re budgeting this winter blind.
- Talk to your team about what “same-day reporting” would change. If the answer is “we’d catch problems a lot faster,” that’s your business case.
Freeze-offs are going to happen this winter somewhere in your field. The question worth answering now, before the first cold snap, is whether your team will find out in 15 minutes or three days, and whether your oilfield freeze off downtime cost gets caught early or discovered later on the balance sheet.
Ready to see what same-day field data actually looks like? Schedule a live demo of automated field-to-report reporting.